Hoardings publicising the Council's delivery of 11,000 council homes are a familiar sight around Southwark. They promote the Council's creditable council house building programme, which it launched in 2013 and describes as the 'most ambitious...in the country'.
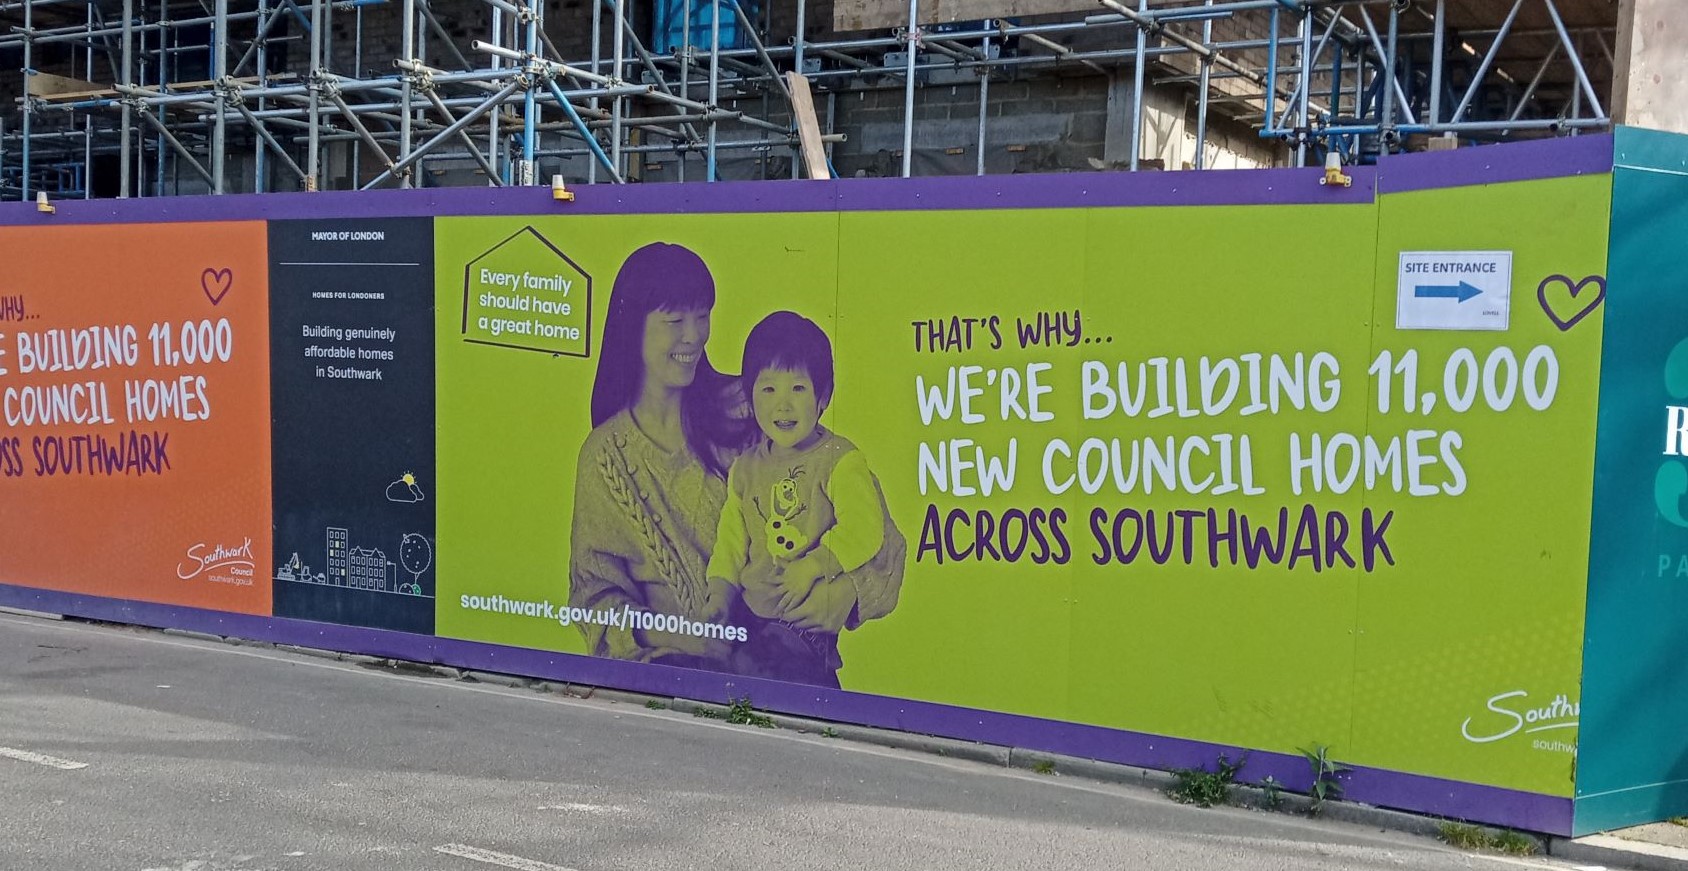
The impression Southwark wants to create is that building social housing is the Council's top priority - as it should be in a borough where only 7% of households can afford free-market housing[^1].
The reality is different. Only one in ten new homes built in Southwark since 2004 is social rented. The figure has emerged from analysis of the London Mayor's new Planning Datahub. The Datahub documents all the homes built in London since 2004, including those built in Southwark[^2]. The Datahub analysis shows that after losses are taken into account, only 2,711 out of twenty-five thousand new homes in Southwark are social rented[^3].
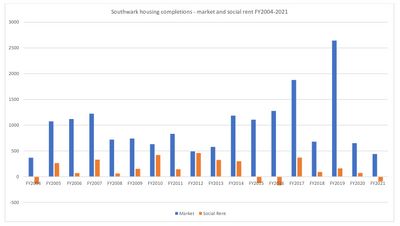
Eighteen years of low social rent, but high free-market numbers
The contrast between the small number of social rent and the large number of free-market homes built is stark, as our chart below shows. The Datahub figures show that nearly 70% of all new homes are free-market (nearly 18,000 in number) against just 10.7% social rent, with the rest made up of other affordable homes[^4].
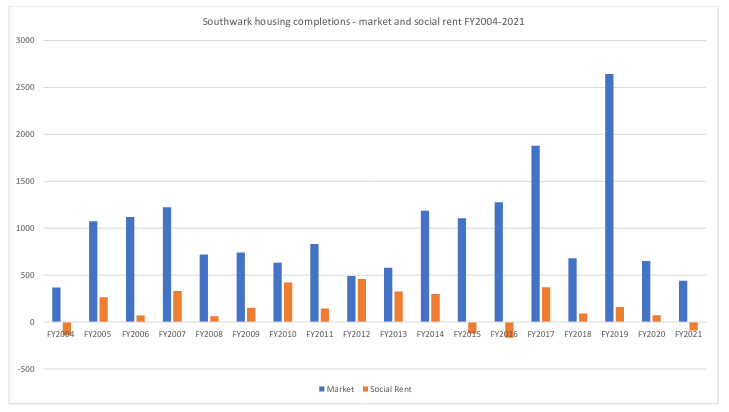
Bar chart by 35% Campaign. Source: Planning London Datahub, Residential Completion Dashboard
Lost Heygate homes
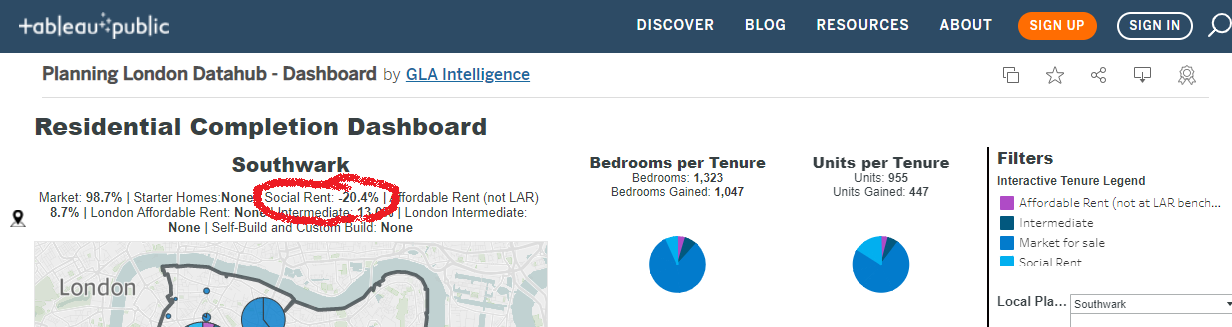
The Datahub also shows that more social rented homes were lost in 2021 than were built. Only 31 were built, while 122 were demolished, with a net loss of 91 homes. Southwark claim this is a 'discrepancy' but the lost units can be identified through the Datahub as being from the demolished Heygate estate[^5].
The Datahub shows the loss clearly, in percentage terms, as minus 20.4% of the total housing delivered in 2021[^6].
Southwark misses the target
Southwark has claimed that it has more than met its target to build 2,500 council homes by 2022, a pledge it made in 2013.
But this target has in fact been missed. Only 2,208 social rented homes have been built in Southwark since 2013, and this includes any council housing built. This figure is calculated from Southwark's own Housing Facts and Figures webpage Table 8. The Mayor's Datahub shows that over the same period 1,136 social rent homes have been lost, mainly through estate demolitions, leaving a net gain of only 1,072 social rented homes[^7].
it should be noted that these figures are from all social rented housing in the borough. It is made up of social housing on private developments, as well as any council housing. The number of council homes built will therefore be a smaller number than the number of social rented homes.
The Council plays with the figures
Southwark is only able to claim that it has fulfilled its 2013 pledge to build 2,500 council homes by 2022, by using an elastic definition if what 'build' actually means. For Southwark, it means the homes do not have to be completed, just started, and can also include other homes brought back into use, according to this Southwark News article.
Southwark also apparently include in the definition of council housing homes gained from private developments, through planning requirements. If this is the case then there is no real gain in social rented housing numbers, because these would have been built anyway, and at private developer's cost.
We need less free-market housing, more social rent
The need for social rented housing has continued to rise since Southwark made its 2013 pledge to build 11,000 council homes over thirty years. The pledge is a good one, but it will probably only maintain the 2013 number of homes, not increase it. Southwark also does itself no favours by exaggerating the progress it is making towards the 11,000 council homes target. The amount of council and social housing being built in the borough is a fraction of the amount of free-market housing and unless this changes and we start getting more social housing from private developers as well as council homes, then Southwark's housing crisis will continue.
Footnotes:
[^1]: 'CACI Paycheck data confirms that 93% of households in Southwark have a household income that requires social and intermediate housing' - para 2, pg 108 Southwark Plan 2022
[^2]: The Planning London Datahub is a 'collaborative project between all of the Planning Authorities in London' including Southwark. It is part of the London Datastore and is a 'new data base that includes data fed live from the boroughs...'. The Datahub's Residential Completion Dashboard shows all housing completions for all the boroughs in London.
[^3]: 5,761 social rented homes were completed, 3,050 s/r homes were lost, leaving a 2,711 net gain for the eighteen financial years FY2004-FY2021. 25,286 homes of all tenures were completed in total, after losses are taken into account. From an analysis of the Residential Completion Dashboard, data filtered for Southwark.
[^4]: 17,651 free-market (69.81%), 2,711 social rent (10.72%), 339 affordable rent (1.34%), 3,572 intermediate (14.13%), 57 Discount Market Rent (0.23%), 956 Other (3.39%) - 25,286 units in total. Completed during the eighteen years FY2004-FY2021. Figures do not include non-conventional units and empty homes brought back into use. From an analysis of the Residential Completion Dashboard, data filtered for Southwark.
[^5]: 31 social rented homes were completed in Southwark in 2021, while 122 were demolished, all on Elephant Park Plots H2 and H3 (14/AP/3438/3439), leaving a net loss of 91 units. More social rented homes were lost than completed in FY 2004 (-140), FY2015 (-121), FY2016 (-166), FY2021 (-91). From an analysis of the Residential Completion Dashboard, data filtered for Southwark.
[^6]: The net gains/losses for FY2021 are 441 free-market units (98.7%), -91 social rent (-20.4%), 39 affordable rent (8.7%), intermediate 58 (13%). From an analysis of the Residential Completion Dashboard, data filtered for Southwark.
[^7]: Southwark's Table 8 gives 'Gross' figures; the Datahub describes the same figures as 'Gains'. The Datahub figures for FY2019 and FY2020 vary from Southwark's, giving total Gains for FY2013 to FY2020 of 2,170, against Southwark's figure of 2,208 for the same period. Datahub figures from an analysis of the Residential Completion Dashboard, data filtered for Southwark.